
ISBI 2026 2026 IEEE 23rd International Symposium on Biomedical Imaging, London, United Kingdom
Automated Landmark Detection for Assessing Hip Conditions: A Cross-Modality Validation of MRI Versus X-Ray
1MaLGa-DIBRIS, University of Genoa, Italy 2Nuffield Department of Orthopaedics, Rheumatology and Musculoskeletal Sciences, Oxford, UK 3Oxford University Department of Computer Science, UK
Abstract
Many clinical screening decisions are based on angle measurements. In particular, FemoroAcetabular Impingement (FAI) screening relies on angles traditionally measured on X-rays. However, assessing the height and span of the impingement area requires also a 3D view through an MRI scan. The two modalities inform the surgeon on different aspects of the condition.
In this work, we conduct a matched-cohort validation study (89 patients, paired MRI/X-ray) using standard heatmap regression architectures to assess cross-modality clinical equivalence. Seen that landmark detection has been proven effective on X-rays, we show that MRI also achieves equivalent localisation and diagnostic accuracy for cam-type impingement. Our method demonstrates clinical feasibility for FAI assessment in coronal views of 3D MRI volumes, opening the possibility for volumetric analysis through placing further landmarks.
These results support integrating automated FAI assessment into routine MRI workflows. Code is released at https://github.com/Malga-Vision/Landmarks-Hip-Conditions.
Key contributions
First cross-modality validation
We present the first cross-modality validation of automated hip landmark detection between X-ray and MRI. Standard heatmap regression models achieve equivalent performance on T1-weighted MRI (2.98 mm vs. 3.02 mm X-ray mean error, 87.5% diagnostic accuracy) on a matched patient cohort.
Clinical workflow integration
By extending measurements conventionally taken from X-rays to the corresponding slice in 3D MRI volumes, we enable seamless integration into clinical workflows.
Foundation for volumetric extensions
We establish a validated 2D foundation for future volumetric extensions towards full 3D geometric analysis and prediction.
Method
Problem formulation
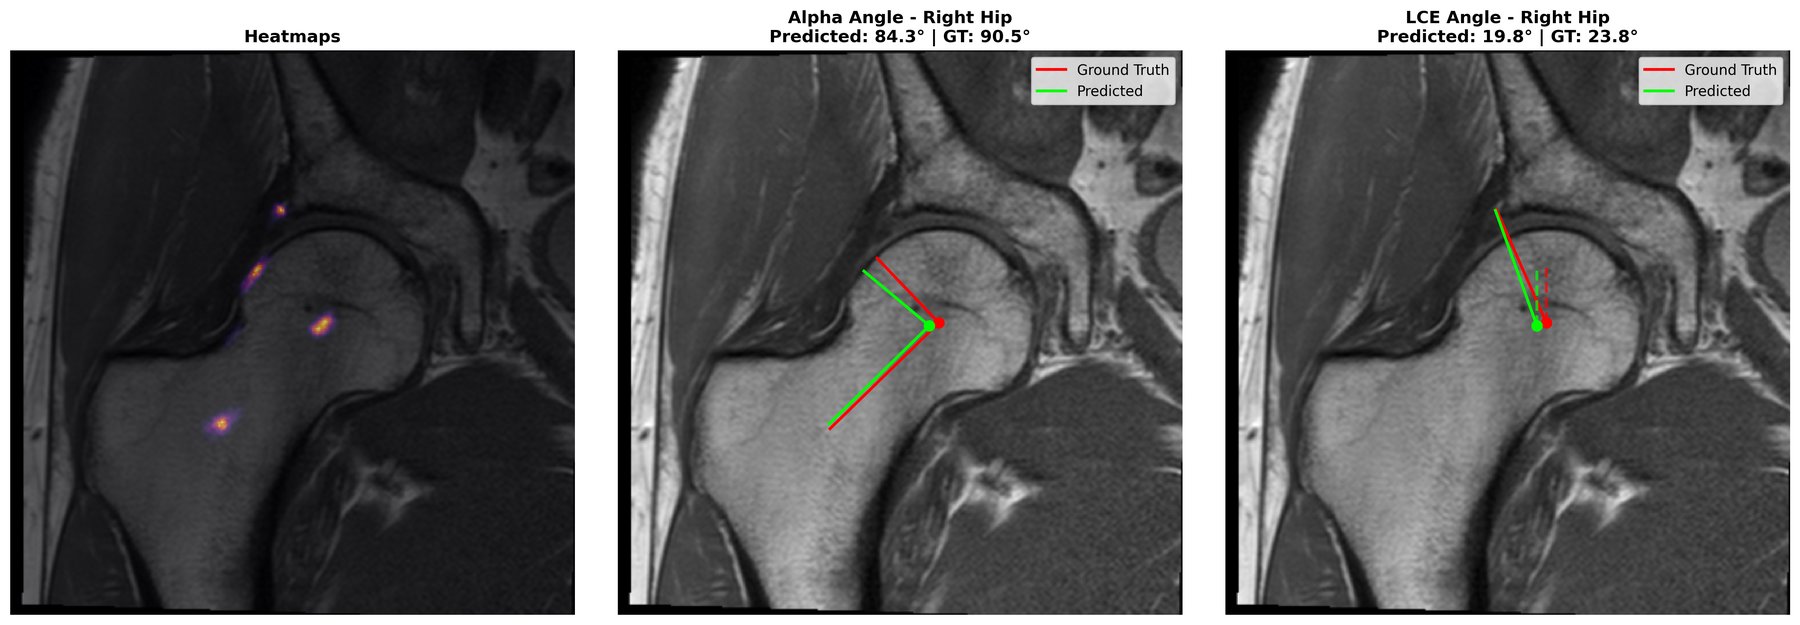
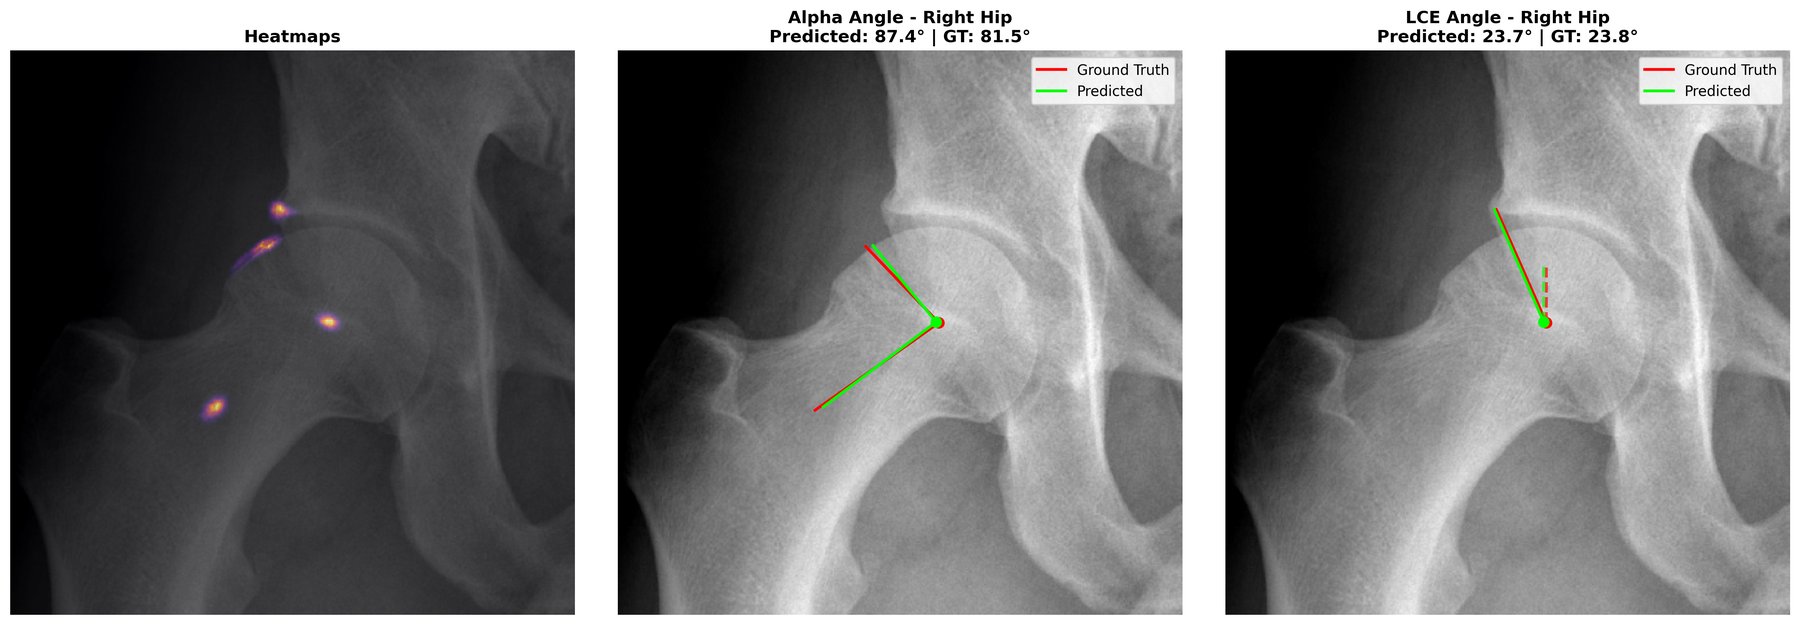
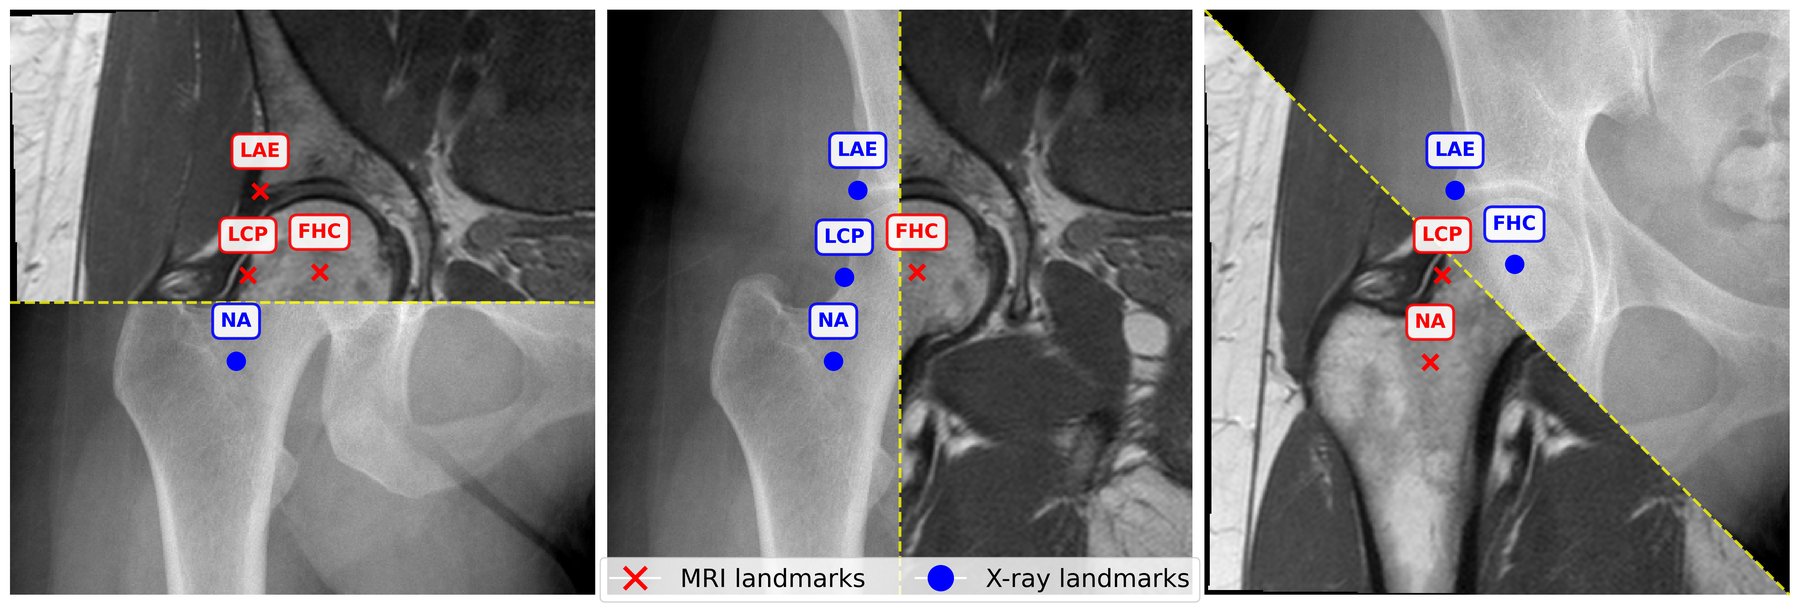
We formulate FAI angle computation as a landmark detection problem. For each hip, we localise four annotated anatomical keypoints: femoral head centre (FHC), neck-axis point (NA) along the femoral neck centreline, lateral acetabular edge (LAE), and lateral cam point (LCP) where the femoral head deviates from sphericity.
The α-angle is computed as the angle between the femoral neck axis (FHC→NA) and the cam deformity vector (FHC→LCP). The LCE angle is calculated as the angle between the vertical axis and the acetabular coverage vector (FHC→LAE), quantifying lateral acetabular overhang.
Heatmap regression architecture
Following established practice in medical landmark detection, we adopt a heatmap regression formulation. For each landmark k, we generate a ground-truth Gaussian heatmap H_k centered at the annotated location. Encoder–decoder networks are trained to predict heatmaps from input images (512×512) by minimizing the negative log-likelihood (NLL) over the four landmarks. At inference, landmark coordinates are extracted as the spatial argmax of each predicted heatmap.
We employ UNet++ with a ResNet18 encoder (ImageNet-initialised) independently on the MRI and X-ray datasets. For robustness, we employ test-time augmentation (TTA) by averaging heatmap predictions across different augmented views per test image.
Experimental results
We use a paired dataset of 89 patients who underwent AP pelvic X-ray and multiple hip MRI for FAI evaluation, collected at Oxford University as part of the FAIT trial. The training:validation:test split is 65:10:25, balanced across α-angle distributions.
Table 1. Landmark localisation accuracy
| Landmark | Mean RE (mm) X-ray | Mean RE (mm) MRI | Median RE (mm) X-ray | Median RE (mm) MRI |
|---|---|---|---|---|
| FHC | 1.07±0.08 | 1.78±0.13 | 1.01±0.11 | 0.84±0.14 |
| NA | 2.35±1.02 | 1.25±0.30 | 1.61±0.17 | 1.13±0.36 |
| LAE | 3.18±0.64 | 3.17±0.30 | 2.81±0.74 | 2.78±0.09 |
| LCP | 5.50±1.01 | 5.72±0.76 | 1.76±0.66 | 2.55±0.64 |
| Overall | 3.02±0.10 | 2.98±0.23 | 1.49±0.16 | 1.62±0.29 |
SDR@2/3/4mm (%) — X-ray: 62.5/79.2/85.4 MRI: 58.3/73.5/83.1
Table 2. Angle measurement agreement and diagnostic accuracy
| Metric | X-ray | MRI |
|---|---|---|
| LCE-angle agreement | ||
| MAE (°) | 2.97±1.14 | 2.96±0.52 |
| Median (°) | 2.22±0.42 | 1.28±0.20 |
| ICC (2,1) | 0.82±0.20 | 0.73±0.14 |
| α-angle agreement | ||
| MAE (°) | 12.18±1.63 | 13.64±1.77 |
| Median (°) | 5.61±1.41 | 5.45±0.77 |
| ICC (2,1) | 0.52±0.06 | 0.41±0.15 |
| Cam screening (α > 65°) | ||
| Accuracy (%) | 87.50 | 87.50 |
| Sensitivity / Specificity (%) | 54.55 / 100.00 | 54.55 / 100.00 |
| PPV / NPV (%) | 100.00 / 85.29 | 100.00 / 85.29 |
| TP / FP / TN / FN | 6 / 0 / 29 / 5 | 6 / 0 / 29 / 5 |
Key findings
- Equivalent localisation accuracy: MRI achieves overall MRE of 2.98±0.23 mm, closely matching X-ray (3.02±0.10 mm)
- Complementary strengths: X-rays excel at FHC localisation (1.07 mm vs. 1.78 mm), while MRI shows superior NA detection (1.25 mm vs. 2.35 mm)
- Identical diagnostic accuracy: Both modalities achieve 87.5% accuracy for cam-type impingement detection with perfect specificity (100%)
- Clinical reliability: LCE-angle shows excellent ICC (X-ray: 0.82, MRI: 0.73), indicating geometric stability
- MRI advantages: Narrower Bland-Altman limits of agreement for LCE (±10.5° vs. ±21.6°) and no proportional bias (p=0.304)
Ablation studies
Table 3. Architecture and TTA impact on MRI performance
| Model | TTA | MRE (mm) | SDR@2mm (%) | Cam Acc. (%) |
|---|---|---|---|---|
| UNet++ (ResNet18) | ✗ | 3.02±0.28 | 56.46±5.87 | 82.33±3.79 |
| ✓ | 2.98±0.23 | 58.44±4.86 | 84.75±2.77 | |
| UNet++ (VGG16) | ✗ | 3.33±0.03 | 56.25±0.89 | 80.00±7.07 |
| ✓ | 3.29±0.36 | 57.09±1.93 | 80.17±4.41 | |
| UNet (MiT-B1) | ✗ | 4.11±0.84 | 54.79±1.44 | 66.67±12.58 |
| ✓ | 3.98±0.54 | 57.33±0.91 | 69.83±6.85 | |
| DPT (ResNet18) | ✗ | 4.49±0.54 | 48.34±3.79 | 67.50±2.50 |
| ✓ | 4.44±0.19 | 50.21±3.02 | 70.17±6.56 | |
| DPT (MaxViT-Base) | ✗ | 3.91±0.87 | 55.50±0.71 | 73.75±8.84 |
| ✓ | 3.63±0.99 | 55.94±1.33 | 77.50±10.61 |
UNet++ with ResNet18 achieves optimal performance. TTA consistently improves all architectures by 1.4-3.6 percentage points in cam accuracy.
Qualitative results
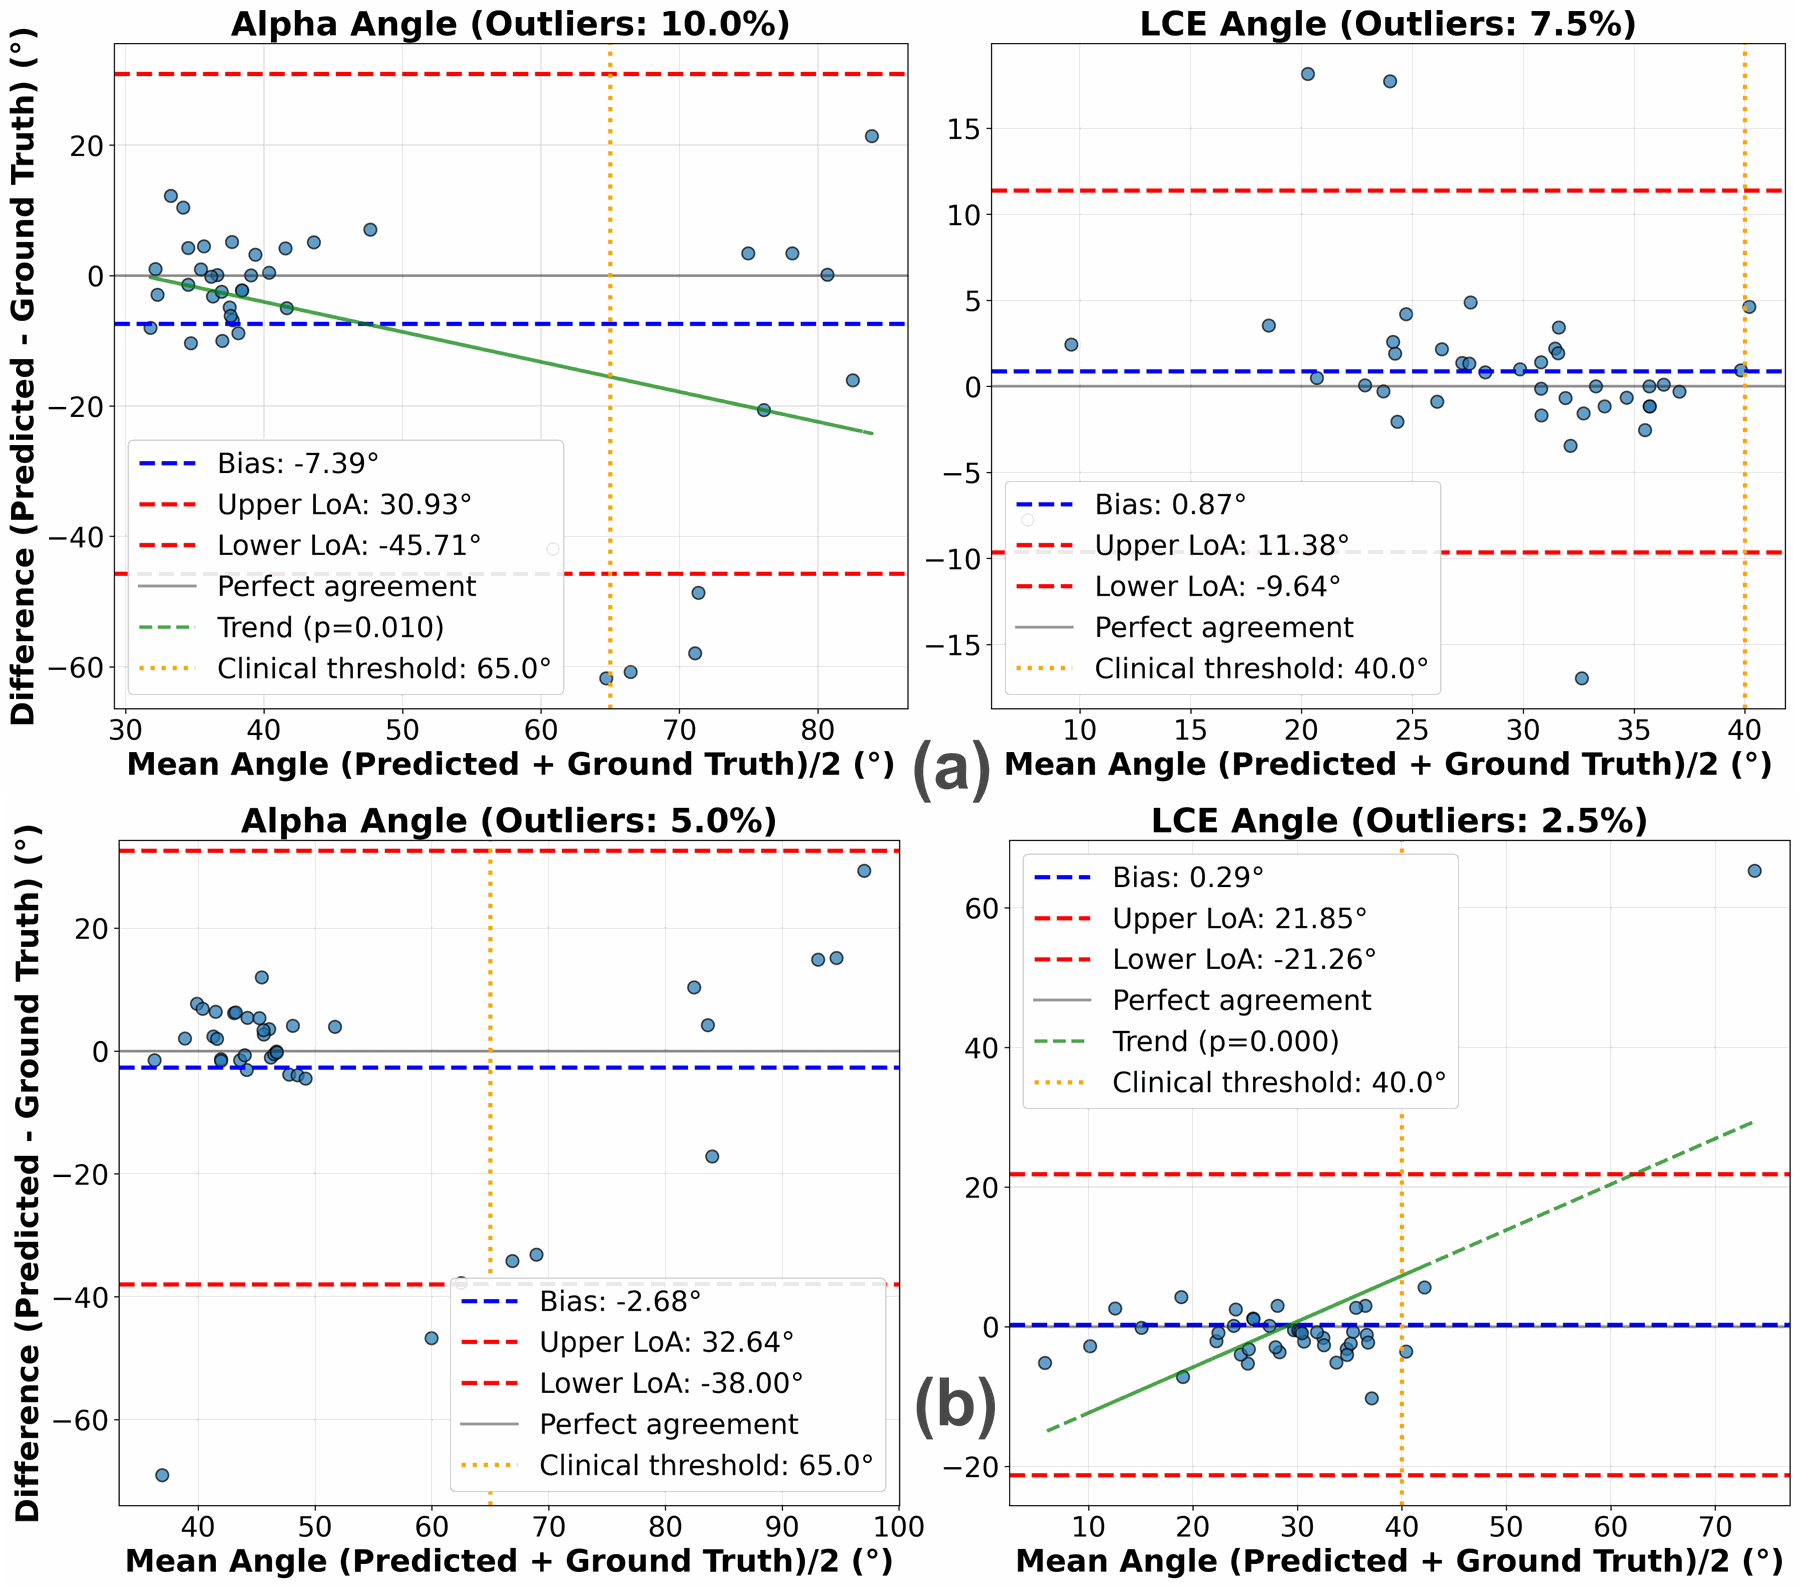
For the LCE-angle, MRI shows minimal bias (0.87°) and narrow LoA (±10.5°) without proportional bias (p=0.304). In contrast, X-ray shows wider LoA (±21.6°) and proportional bias (p<0.001), with errors increasing at higher acetabular coverage, suggesting more stable estimation from MRI.
For the α-angle, both modalities underestimate clinician measurements (X-ray: -2.68°, MRI: -7.39°) with broad LoA (X-ray: ±35.3°, MRI: ±38.3°). X-ray errors remain magnitude-independent (p=0.518), whereas MRI shows proportional bias (p=0.010), reflecting slice-selection sensitivity. Despite these biases, both modalities achieve reliable cam-type classification (specificity 100%, sensitivity 54.6%), indicating that residual variability mainly arises from landmark ambiguity rather than modality differences.
ISBI 2026 presentation
Frequently asked questions
What does the ISBI 2026 paper on automated hip landmark detection study?
It presents the first cross-modality validation of automated hip landmark detection between X-ray and MRI for femoroacetabular impingement (FAI) assessment. A heatmap regression network localises four landmarks (femoral head centre FHC, neck-axis point NA, lateral acetabular edge LAE and lateral cam point LCP), from which the α-angle (cam morphology) and the lateral centre-edge (LCE) angle are computed. The paper was published at the 2026 IEEE 23rd International Symposium on Biomedical Imaging (ISBI).
What data was used?
A matched cohort of 89 patients from the FAIT trial (collected at Oxford University) with paired anteroposterior pelvic X-rays and T1-weighted coronal hip MRI (20 slices, 3.3 mm spacing). MRI annotations are standardised to the middle slice (index 10). The 65:10:25 train:validation:test split, balanced across α-angle distributions, yields 105:17:40 images (57:8:24 patients).
Which model is used?
A UNet++ with an ImageNet-initialised ResNet18 encoder, trained independently on MRI and X-ray with Gaussian target heatmaps, a negative log-likelihood loss on 512×512 inputs, and test-time augmentation. In the ablation it outperforms UNet++ (VGG16), UNet (MiT-B1) and DPT variants on MRI.
Is automated landmark detection on MRI as accurate as on X-ray?
Yes. Over three runs the overall mean radial error is 2.98±0.23 mm on MRI and 3.02±0.10 mm on X-ray. For cam-type impingement screening (α > 65°) both modalities reach 87.5% accuracy with 100% specificity and 54.55% sensitivity. The LCE-angle shows ICC(2,1) of 0.82 on X-ray and 0.73 on MRI, and MRI has narrower Bland-Altman limits of agreement for the LCE-angle (±10.5° vs. ±21.6°).
Is the code available?
Yes. The code is released at https://github.com/Malga-Vision/Landmarks-Hip-Conditions and the paper is available on arXiv (2601.18555) and IEEE Xplore (DOI 10.1109/ISBI61048.2026.11515938).
Citation
@inproceedings{divia2026hip,
  title={Automated Landmark Detection for Assessing Hip Conditions: A Cross-Modality Validation of {MRI} versus {X-ray}},
  author={Di Via, Roberto and Pastore, Vito Paolo and Odone, Francesca and Glyn-Jones, Si{\^o}n and Voiculescu, Irina},
  booktitle={2026 IEEE 23rd International Symposium on Biomedical Imaging (ISBI)},
  pages={1--4},
  year={2026},
  publisher={IEEE},
  doi={10.1109/ISBI61048.2026.11515938}
}